Course summary
-
Get individual feedback
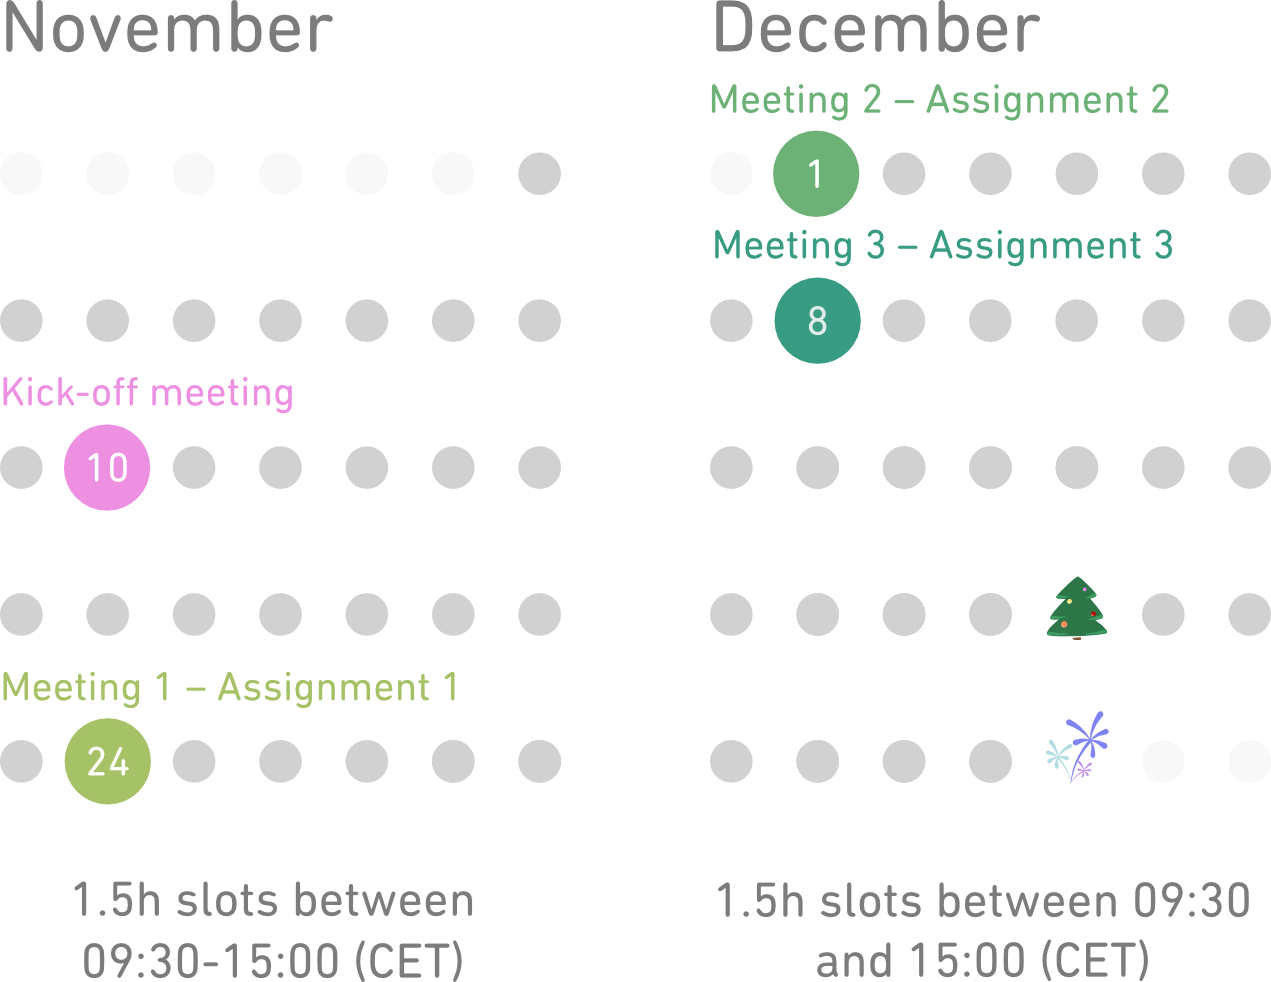
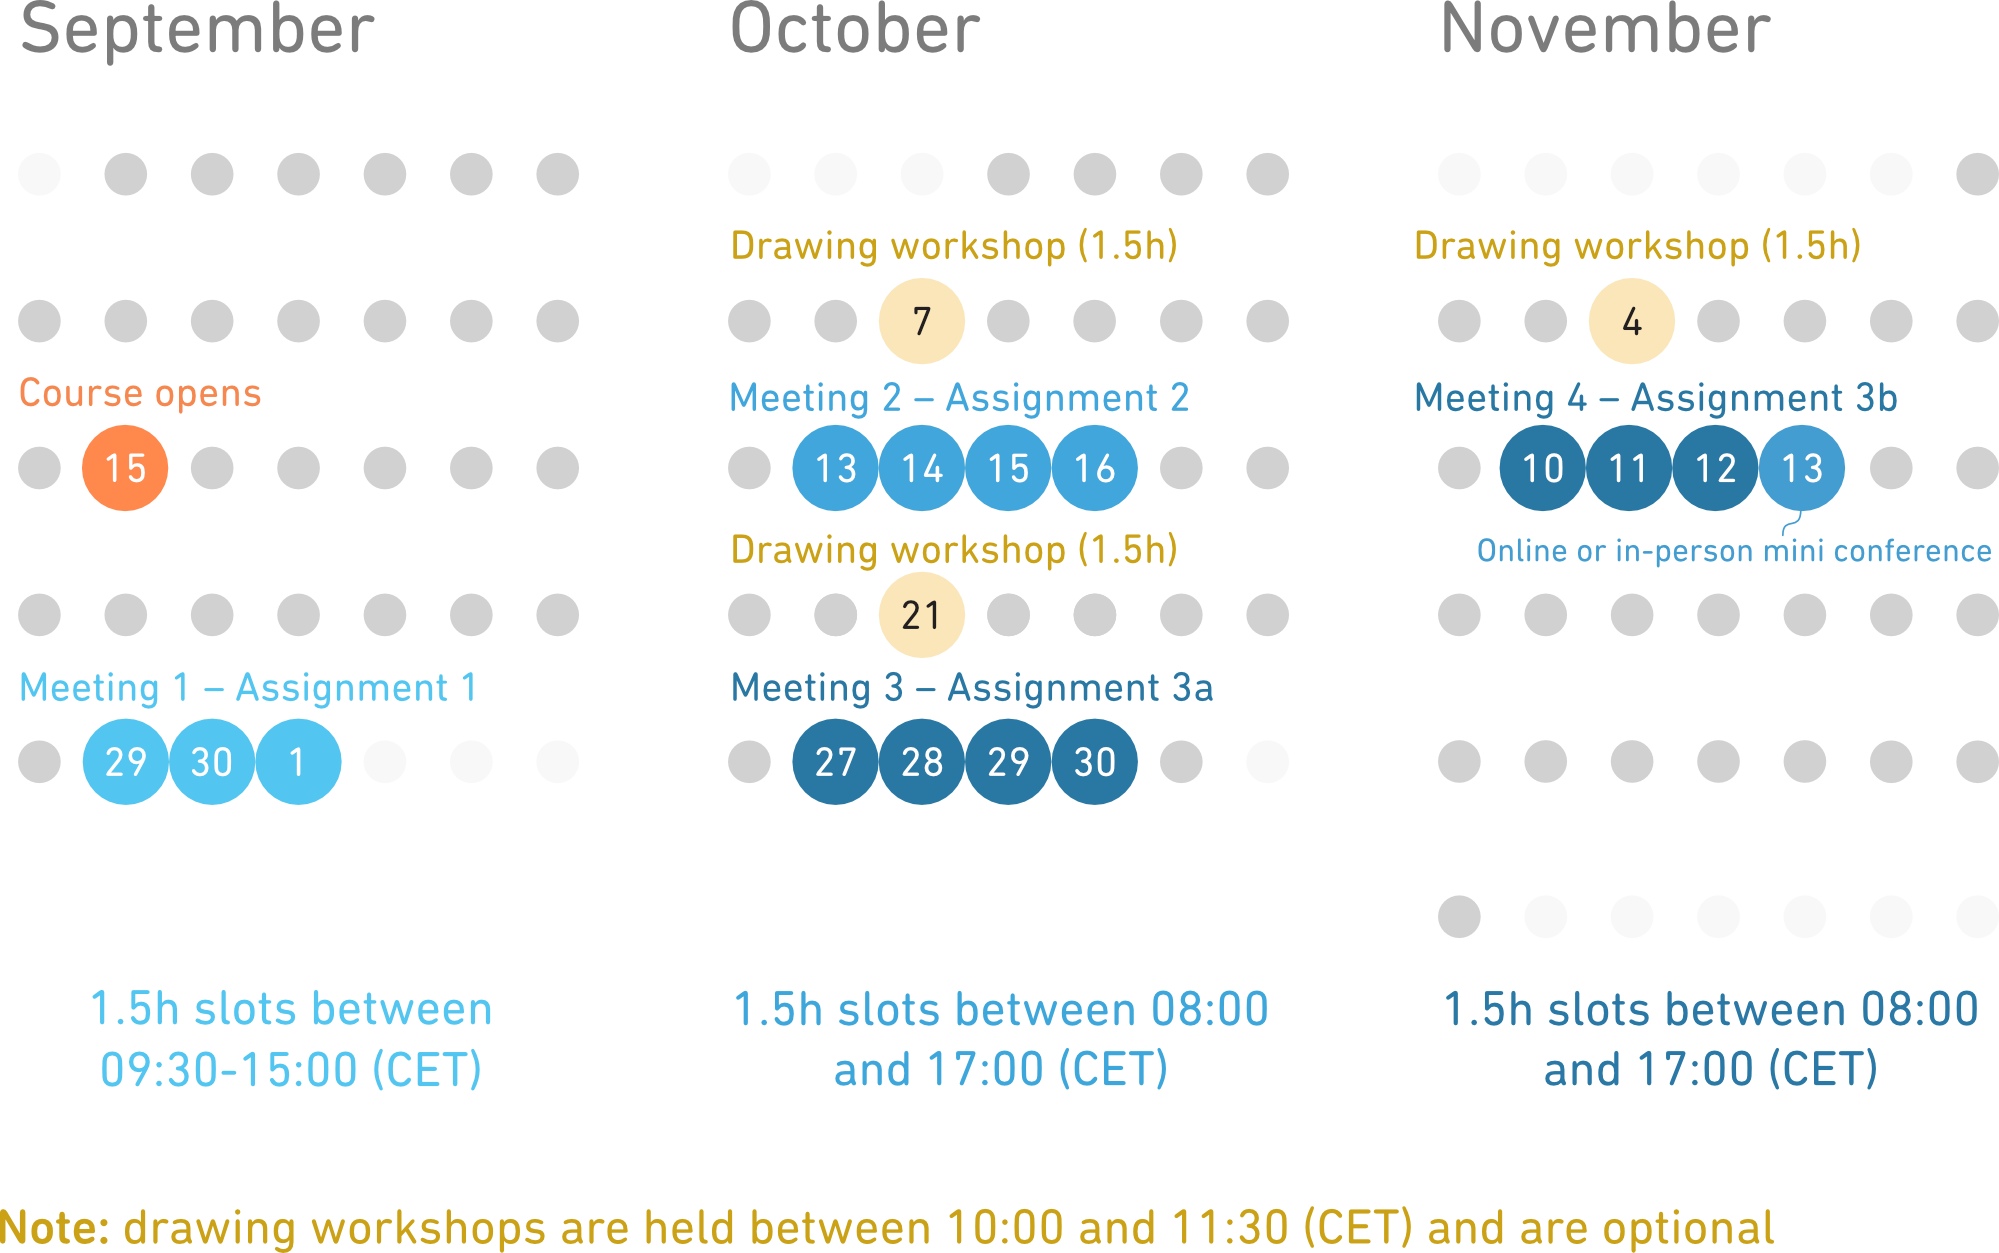
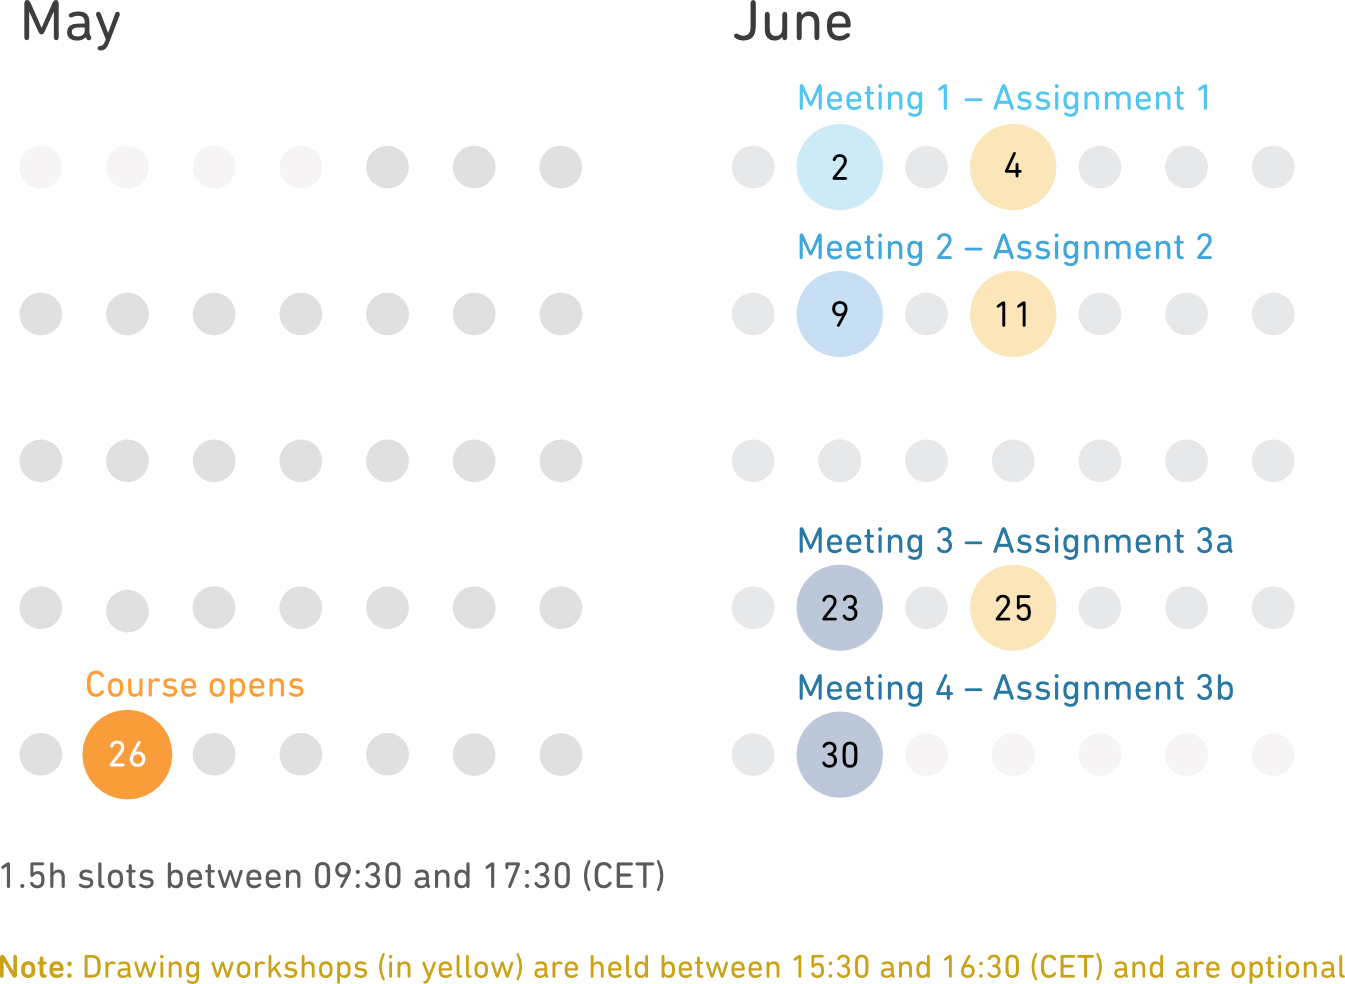
You will meet our instructors over Zoom* and get personal feedback after each assignment. You also have access to an online community where you can ask questions or request additional feedback on your work. -
Study at your own pace
A researcher's time is valuable and often limited. The course material is in video format for self-study, allowing you to learn around your schedule. You will also have lifelong access to all course videos and all future updates of the course material. -
Design communicative plots
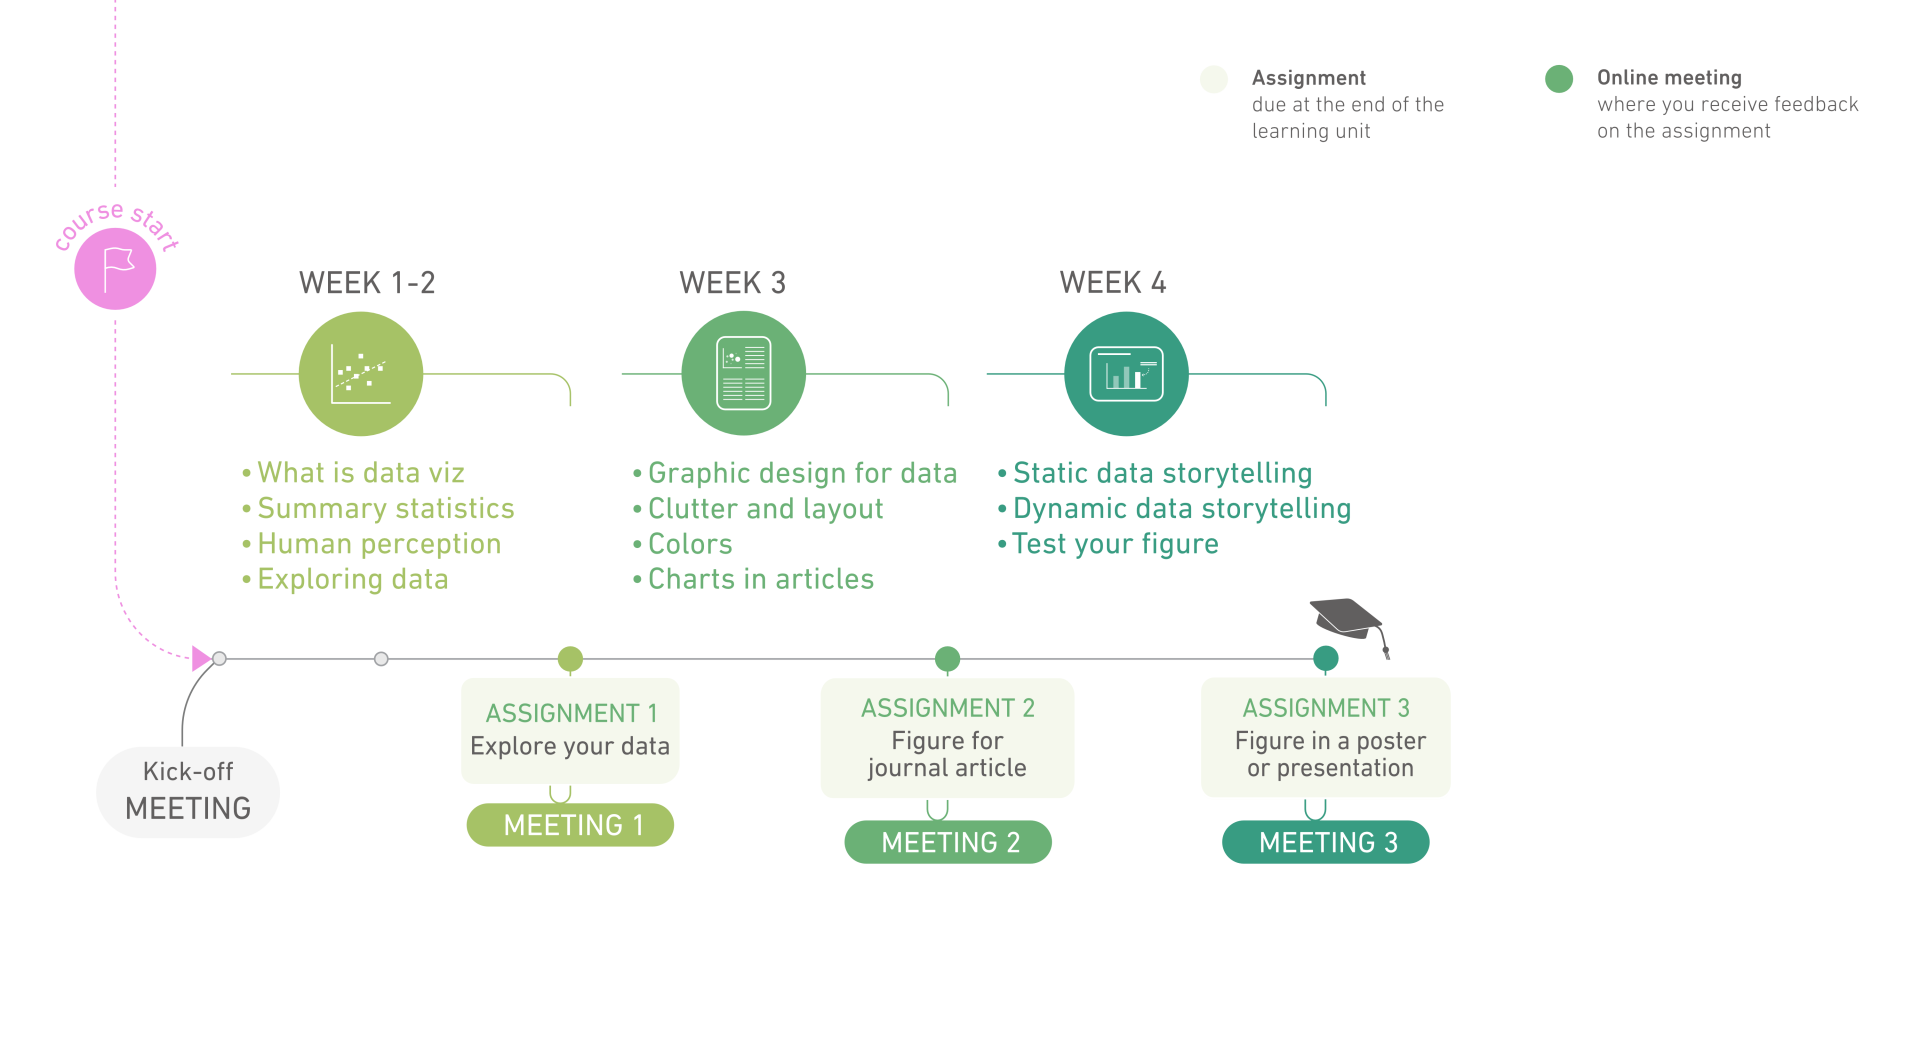
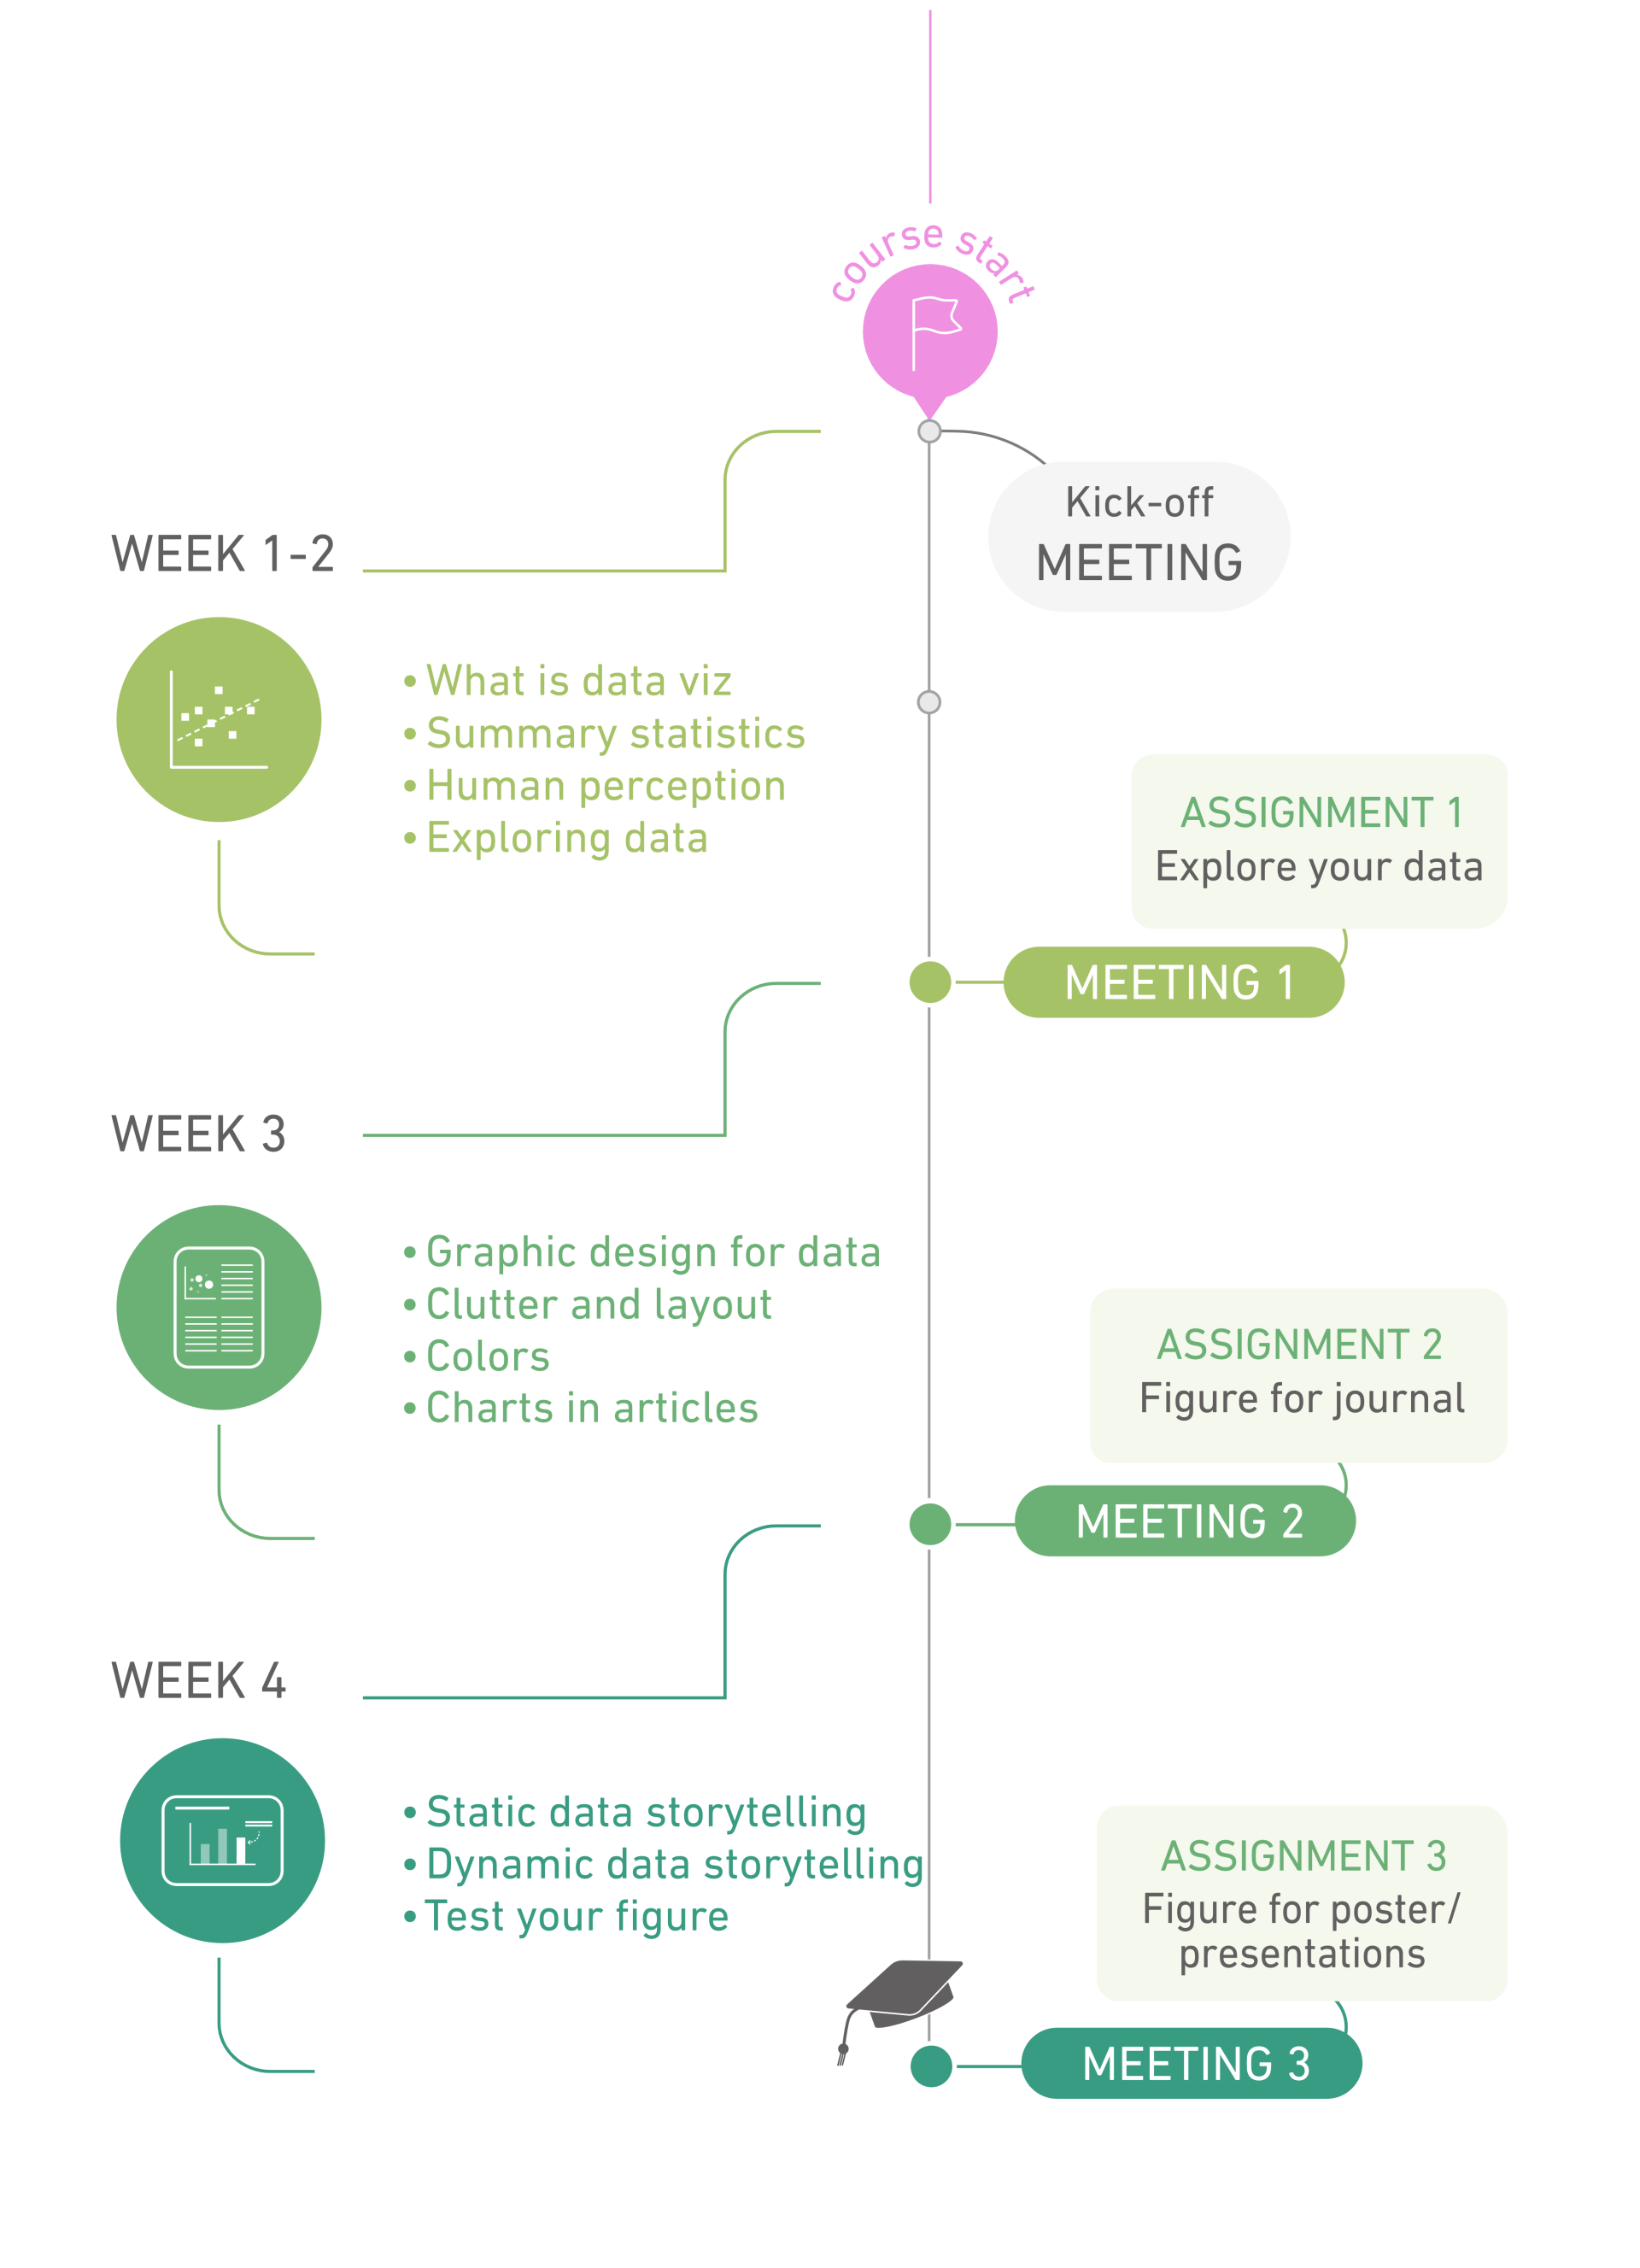
During the course, three assignments will guide you towards creating communicative data visualizations:
- Assignment 1: Explore your dataset with different plots
- Assignment 2: Redesign your plot to get it journal-ready
- Assignment 3: Animate your plot for a presentation
-
Make your data talk!
You will end the course by presenting an animated visualization of your data, and you will get the chance to learn from fellow students' own data animations.