Visualize your Science
Course summary
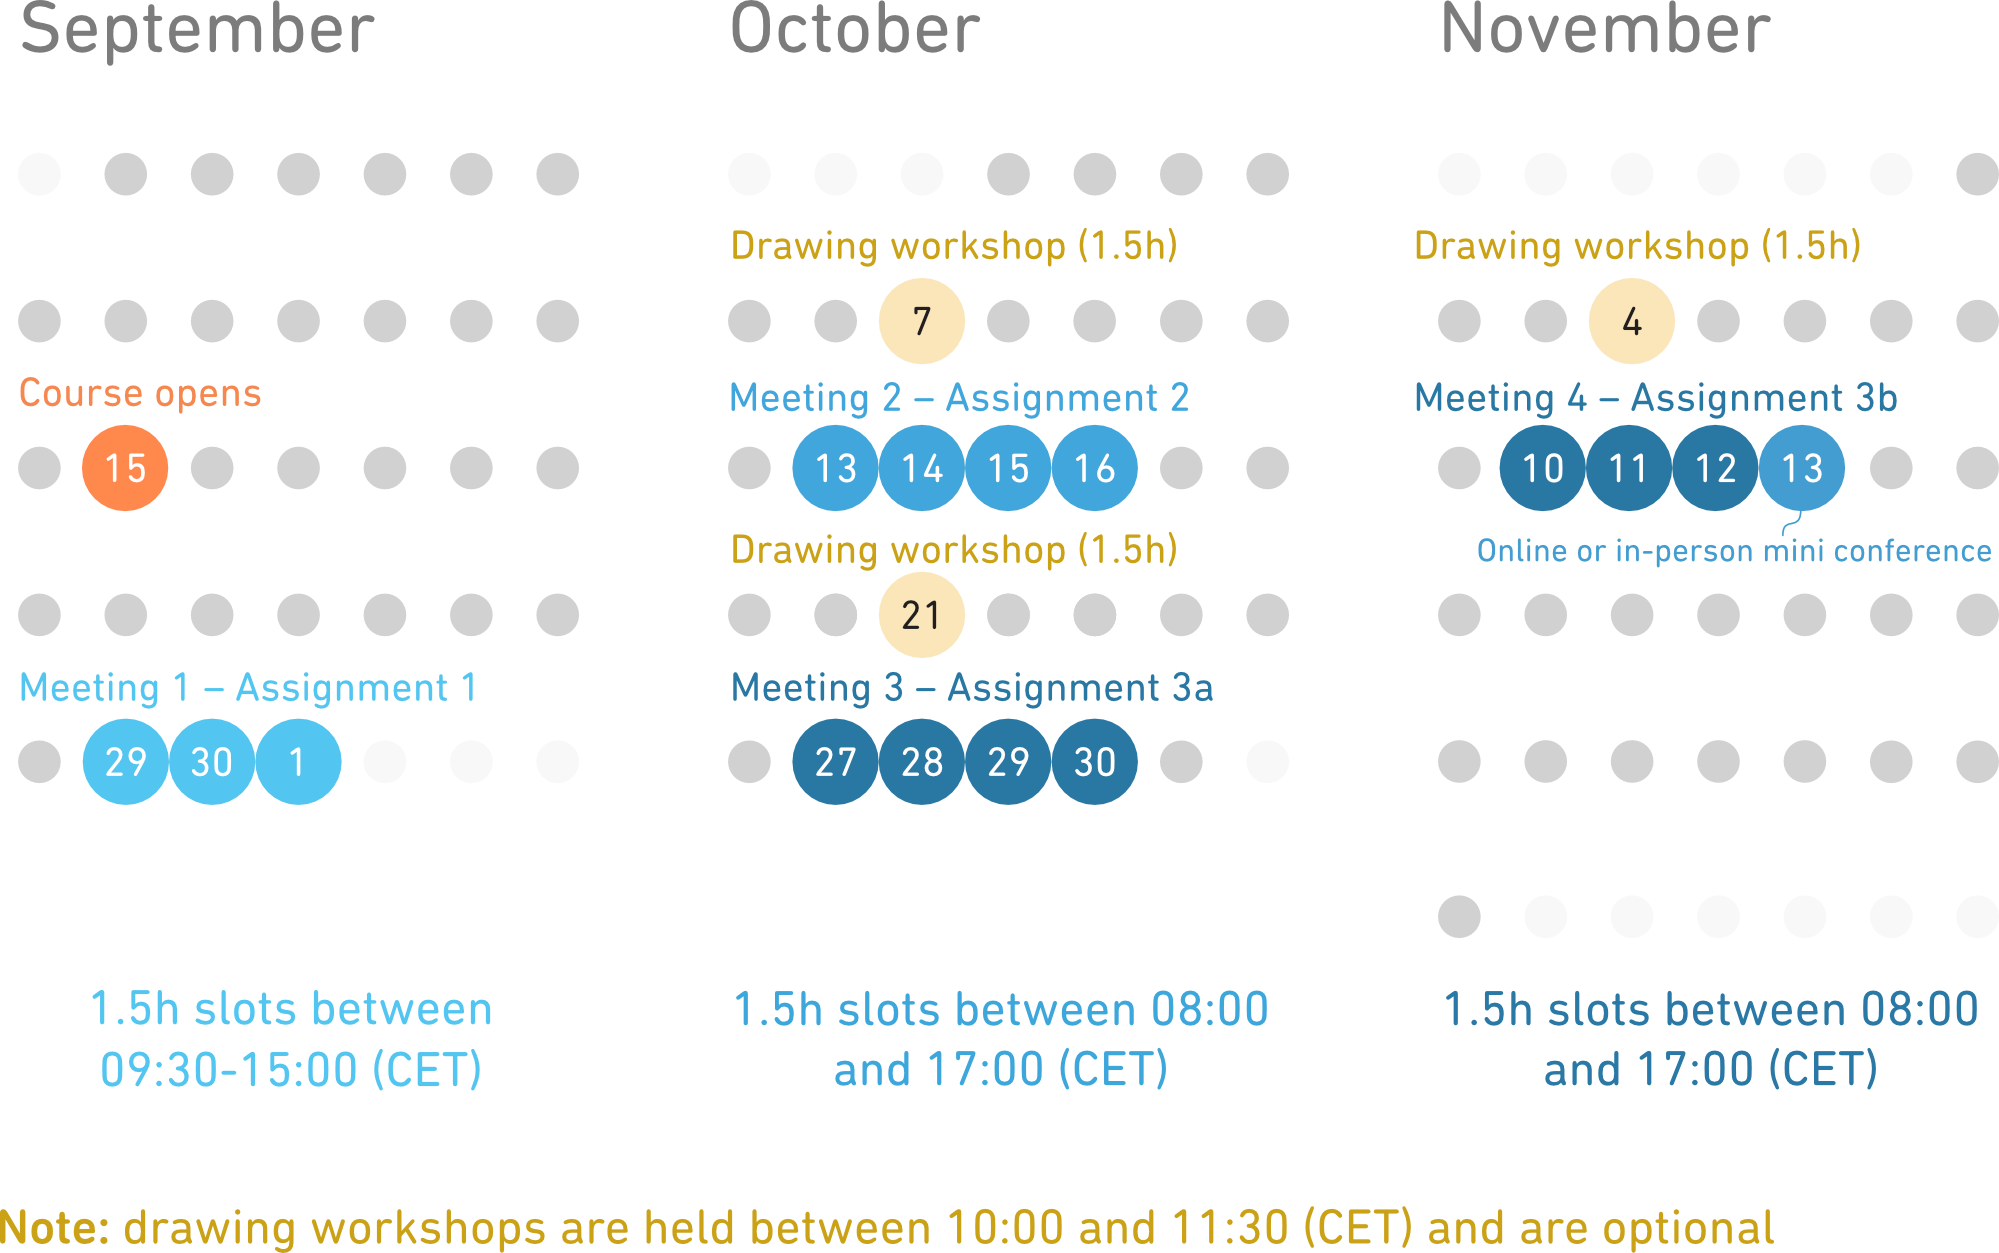
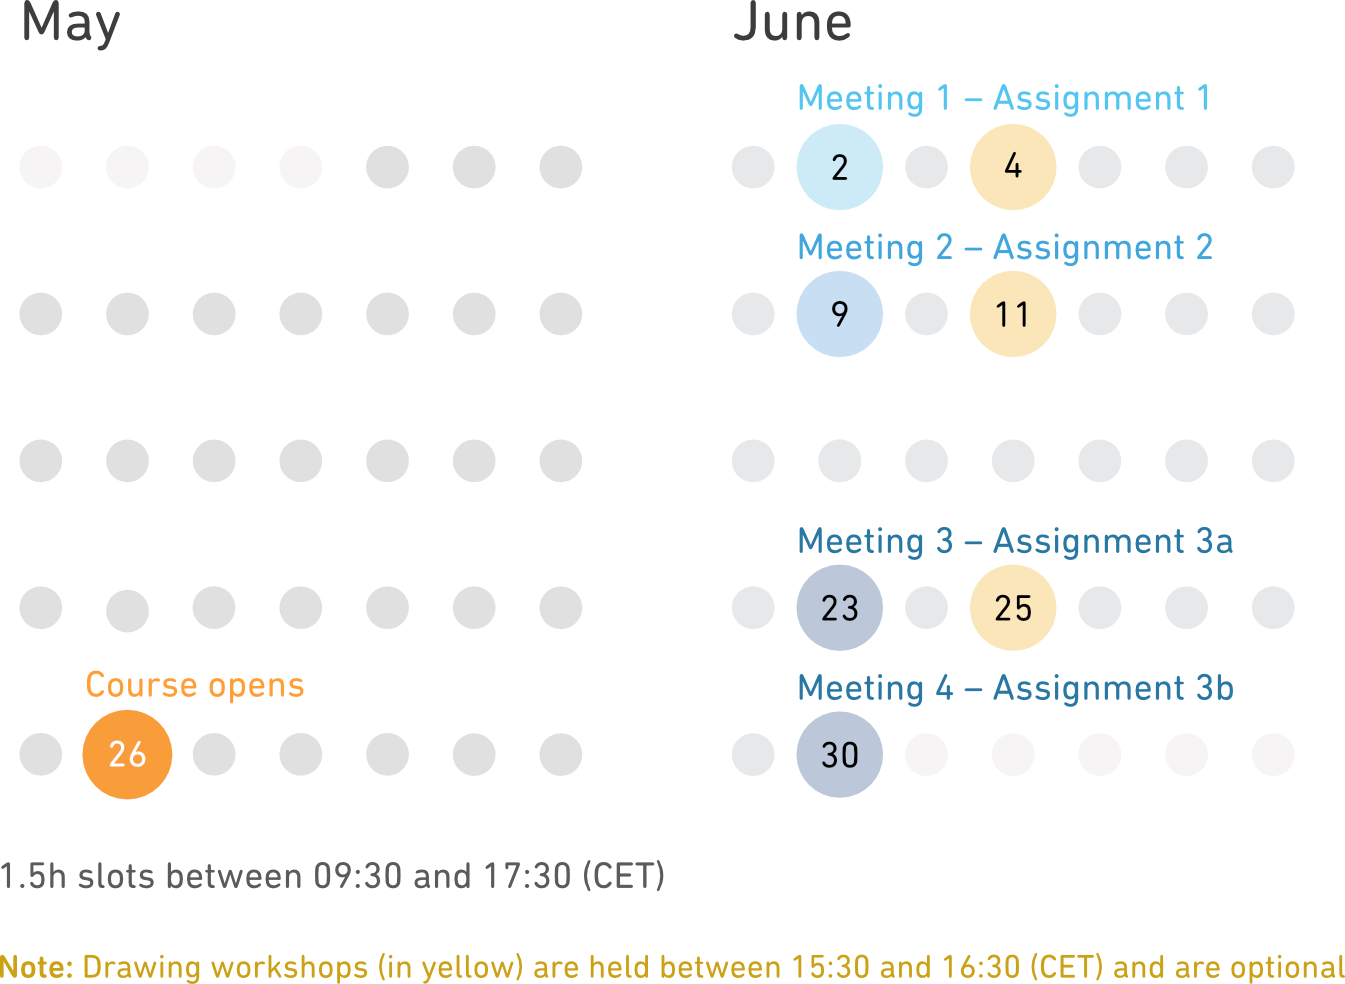
Course structure
-
Study at your own pace
A researcher's time is valuable and often limited. For this reason, we have made the course material available in video format for self-study, allowing you to learn at your own pace and schedule.
After the course ends, you will have unlimited access to all course videos and all future updates of the course material! -
Feedback sessions
Throughout the course, you meet with your instructors and get personal feedback after each assignment. These video feedback sessions are held over Zoom. Session times are adapted for our European audience, but flexible. Let us know your location so we can find suitable time slots!
There are also online Q&A sessions between assignments, where you can ask questions directly to the instructors. In addition, you have access to an online community where you can ask questions or request feedback on your work. -
Assignments
Three assignments, each increasing in complexity, are given during the course. These will familiarize you with your chosen illustration software and train you in creating graphical abstracts and scientific posters.- Assignment 1: Draw a kitchen appliance or lab equipment
- Assignment 2: Make a graphical abstract about your own research
- Assignment 3: Design a poster for your research
-
Congratulations!
The course culminates in a mini-conference-style online session, where you will have the chance to learn about the work of your fellow students and present the poster you created in this course.
In the Autumn and Spring courses, the mini-conference is organized as an optional in-person event (typically held somewhere in Sweden or in one of the other Nordic countries).
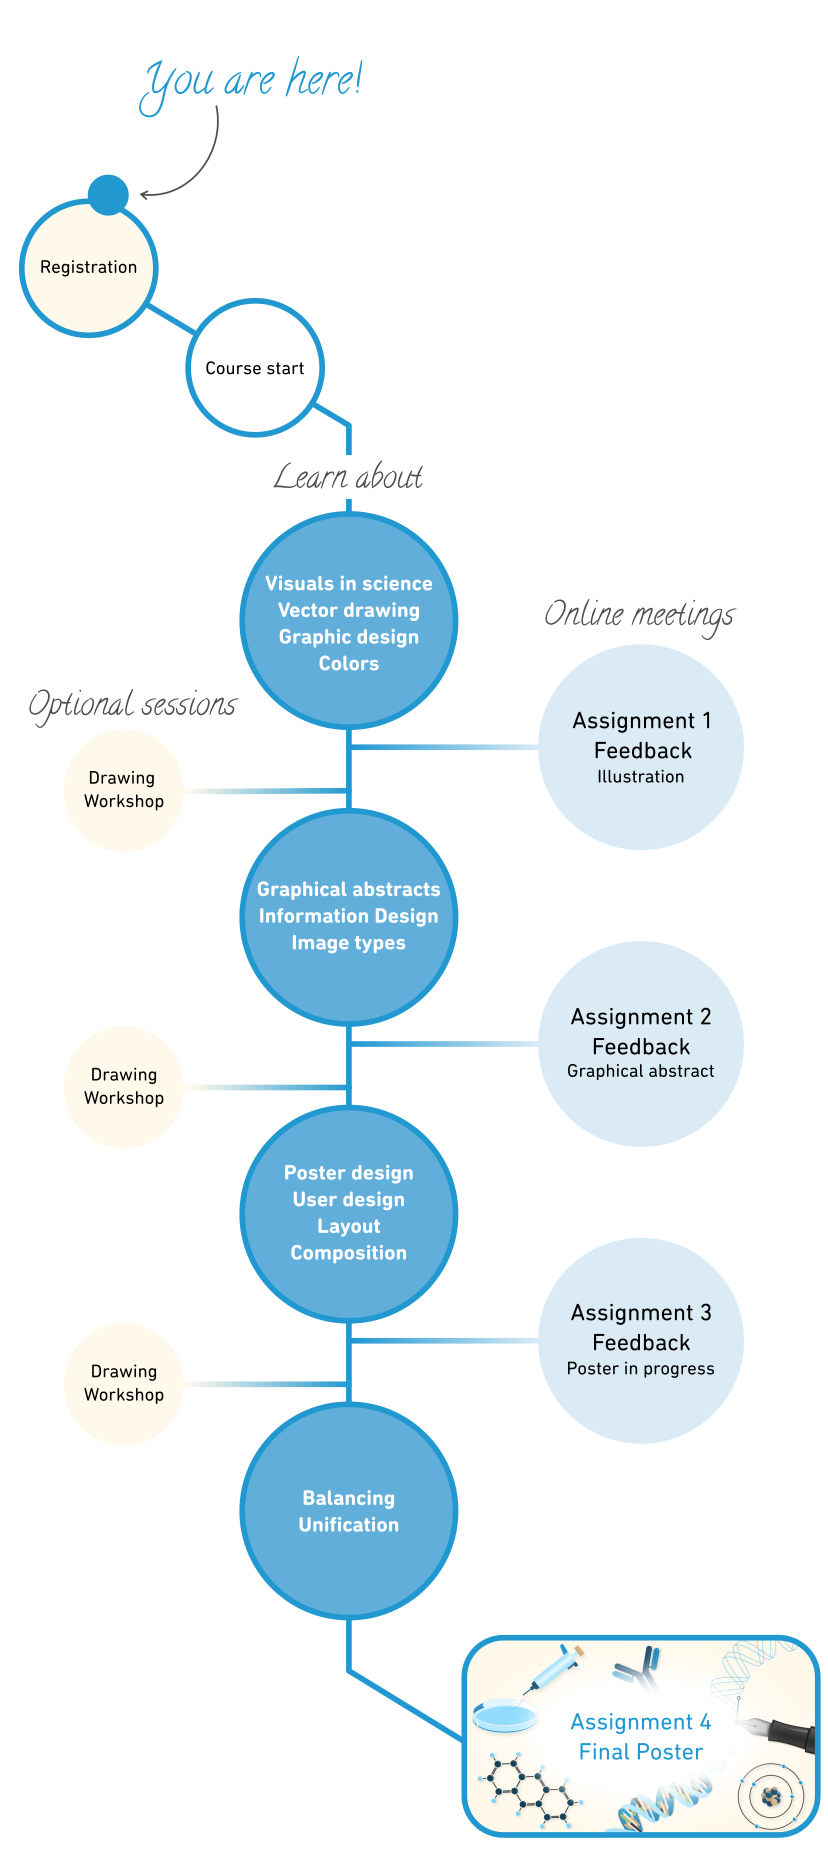
Learning outcomes
In this course you will learn digital illustration and gain skills that will help you clearly communicate your message:
Professional illustration software
The course will take you through the technicalities of creating vector-based illustrations using Adobe Illustrator, Affinity Designer or Inkscape, your choice.
Unique poster design
The course will teach you to break the template and create captivating posters with character that are uniquely yours.
Effective design principles
We will teach you how to present and arrange the elements on your page to maximize the impact of your message.
Find the core of your research
Working within the constraints of the assignments teaches you to summarize your message and think outside the box.
Visual thinking
You will get into the mindset of translating your research to visuals by completing assignments and giving as well as receiving feedback.
Engaging storytelling
You will learn to break convention and think critically about the information you put on the page, helping you tell better stories with your visuals.
3500+ students from 80+ universities have taken our course
Join them today!
Overall the course has been very helpful and allowed me to think more in terms of illustration/graphical communication.
Andreas Novotny
I think it was the most useful course I have followed so far. It makes me more confident as a researcher that I can make graphs that are as pretty as what I have in my head and I think that would be helpful for more colleagues. I love how the course gives insight in things that you more or less feel is wrong with a visual (poster, slide, etc.) and it is nice to approach this with knowledge and a more scientific approach. I expect colleagues would agree.
LISETTE VAN KOLFSCHOTEN
You have fundamentally changed my understanding of the world and how I should communicate.
Alexis Dziedziech
At first I thought I would have trouble with illustration but I really enjoyed it and liked how the development process were. I never ended up where I thought I would in the beginning. The results were so much better than I could have imagined in the beginning
Jonna Lind
I think this is one of very few courses that have actually exceeded my expectations. I knew nothing about Illustrator and this course not only taught me so many skills, it also built up my confidence with this tool. I have never been "geeky/techie" so I expected to have difficulties during this course and a very steep learning curve. However I found the complete opposite, after only a few hours I was able to sketch anything I wanted in very high quality, I was surprised at how easy it actually is and how good it looks. Thanks to Andreas who has perfectly broken it down step-by-step for everybody to follow.
EVA GRACIA VILLACAMPA
It is a SUPER useful course for all scientists! It has incredibly good structure, a lot of necessary information, which will improve any poster, presentation or etc
EVGENIYA MICKOLS
You don't need to know anything about the visualisation tool and you will end the course by feeling comfortable to making award-winning figures. Not only does one get a lot of teachings on how to use the tool, it also gives a lot of relevant guides, rules and tips on making very good science visualisations. It will be helpful for the rest of one's career. And there is a lot of practice, including making your own poster and graphical abstract
JOHANNES YAYO