Welcome to

Join our courses today!
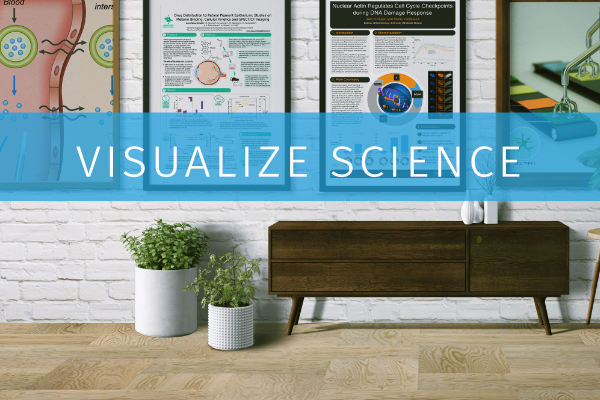
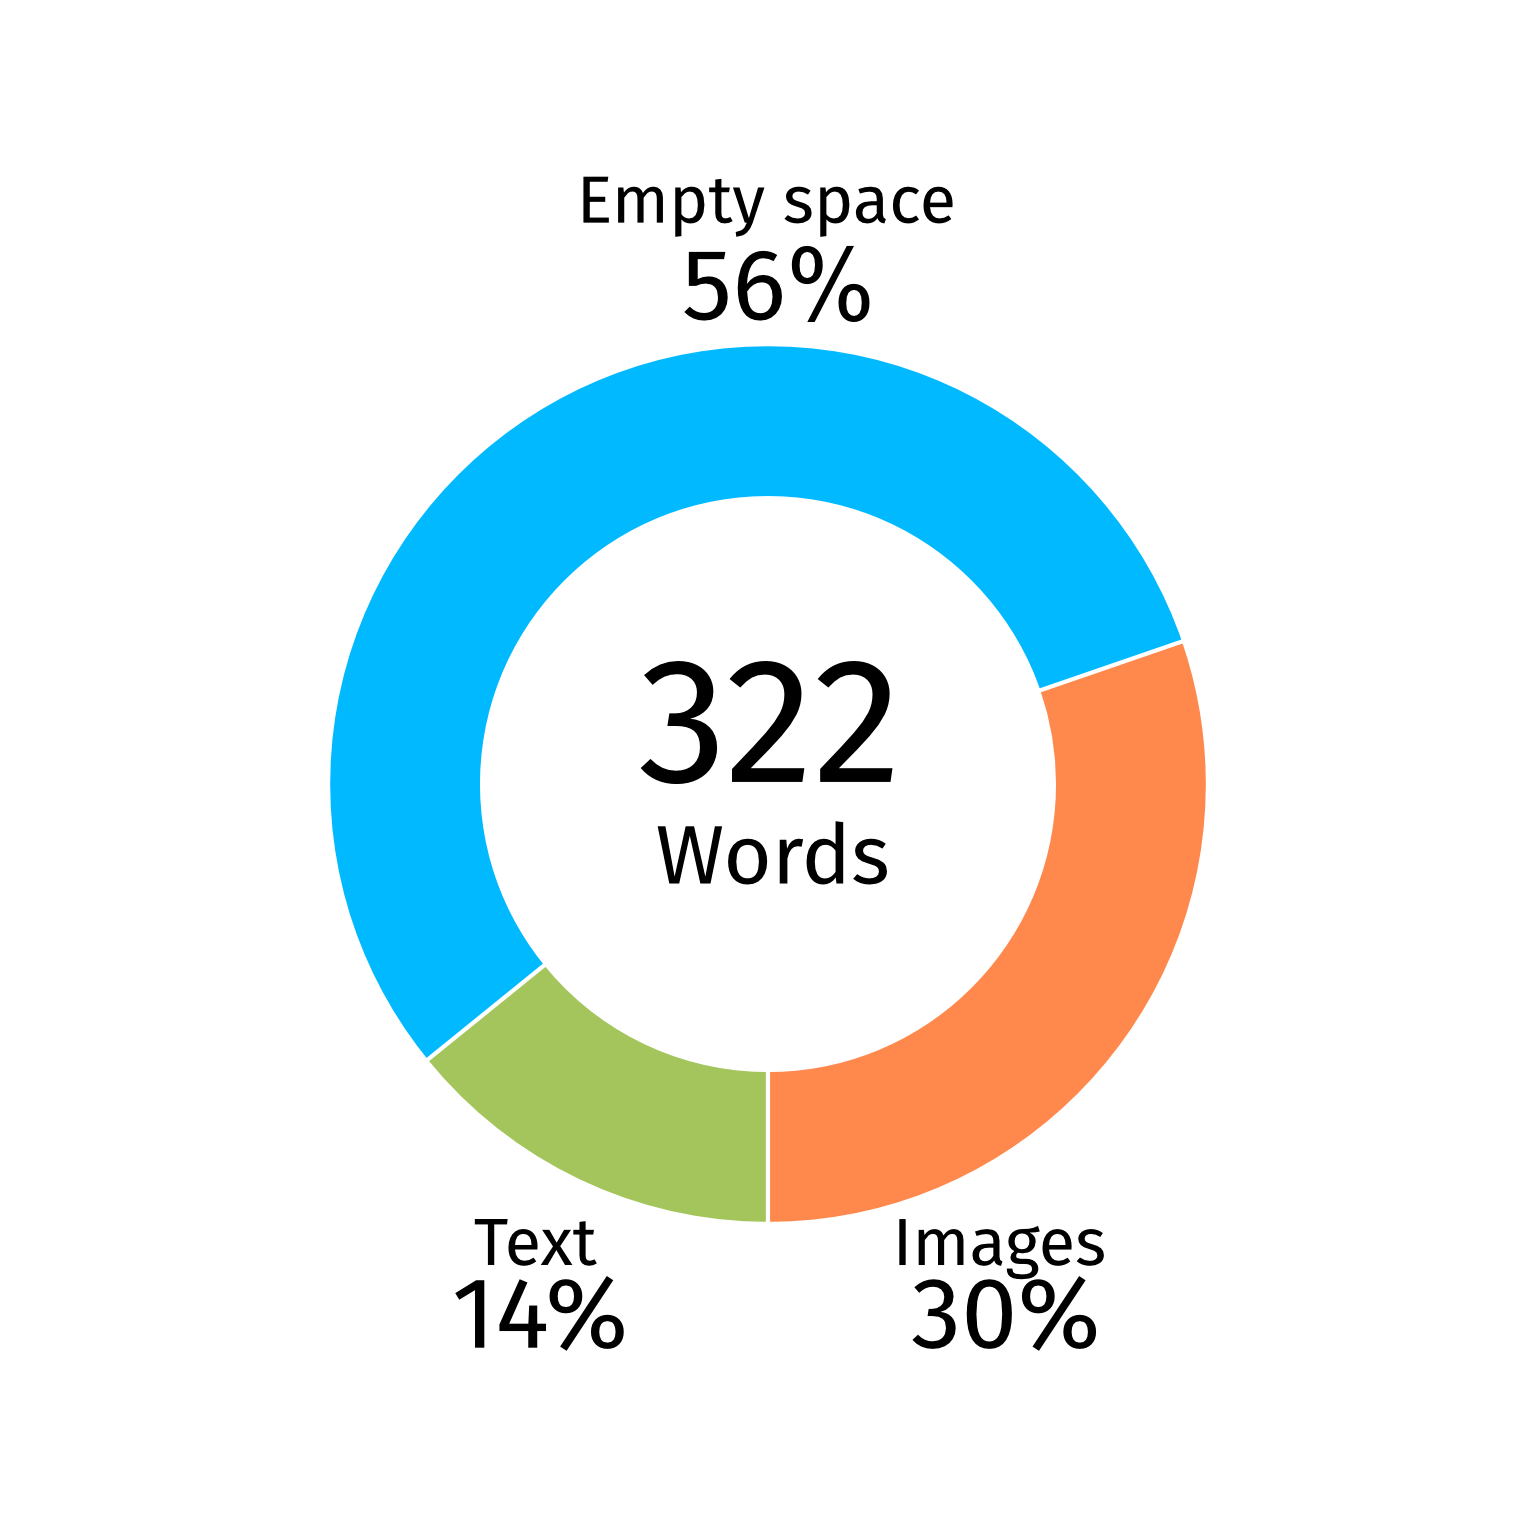
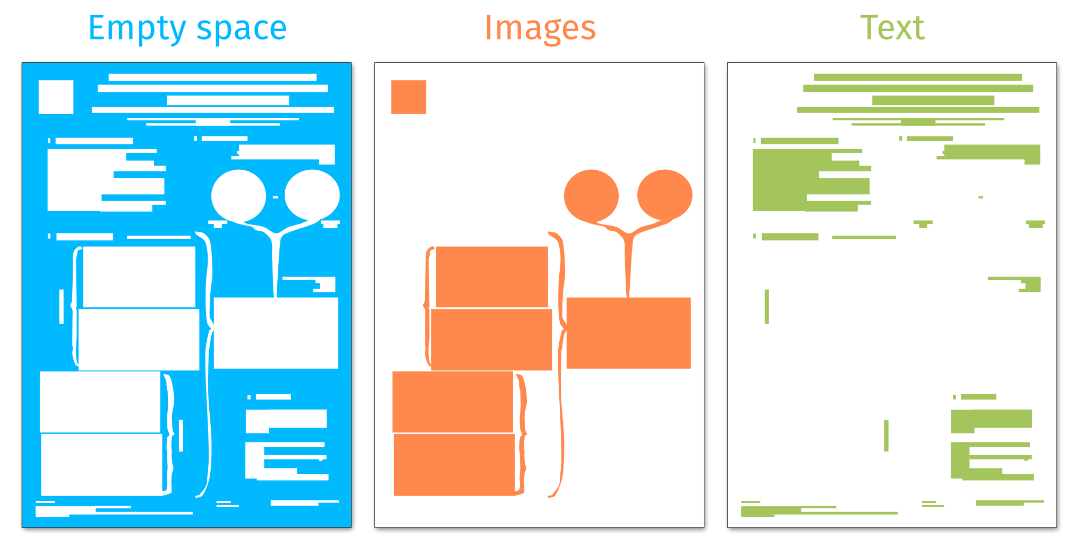
Visualize your Science
Animate your Science
Present your Science
3000+
60+
3
2011
With students and collaborators from these universities
Write your awesome label here.
Write your awesome label here.
Write your awesome label here.
Write your awesome label here.
Write your awesome label here.
Write your awesome label here.
Write your awesome label here.
Write your awesome label here.
Write your awesome label here.
Write your awesome label here.
Write your awesome label here.
Write your awesome label here.
With students and collaborators from these companies
Write your awesome label here.
Write your awesome label here.
Write your awesome label here.
Write your awesome label here.
Write your awesome label here.
Write your awesome label here.
Write your awesome label here.
Write your awesome label here.
Write your awesome label here.
Write your awesome label here.
Write your awesome label here.
Write your awesome label here.
With students and collaborators from these universities
Write your awesome label here.
Write your awesome label here.
Write your awesome label here.
Write your awesome label here.
Write your awesome label here.
Write your awesome label here.
Write your awesome label here.
Write your awesome label here.
Write your awesome label here.
Write your awesome label here.
Write your awesome label here.
Write your awesome label here.
With students and collaborators from these institutions
Write your awesome label here.
Write your awesome label here.
Write your awesome label here.
Write your awesome label here.
Write your awesome label here.
Write your awesome label here.
Write your awesome label here.
Write your awesome label here.
Write your awesome label here.
Write your awesome label here.
Write your awesome label here.
Write your awesome label here.
With students and collaborators from these universities
Write your awesome label here.
Write your awesome label here.
Write your awesome label here.
Write your awesome label here.
Write your awesome label here.
Write your awesome label here.
Write your awesome label here.
Write your awesome label here.
Write your awesome label here.
Write your awesome label here.
Write your awesome label here.
Write your awesome label here.
With students and collaborators from these authorities
Write your awesome label here.
Write your awesome label here.
Write your awesome label here.
Write your awesome label here.
Write your awesome label here.
Write your awesome label here.
Write your awesome label here.
Write your awesome label here.
Write your awesome label here.
Write your awesome label here.
Write your awesome label here.
Write your awesome label here.
With students and collaborators from these universities
Write your awesome label here.
Write your awesome label here.
Write your awesome label here.
Write your awesome label here.
Write your awesome label here.
Write your awesome label here.
Write your awesome label here.
Write your awesome label here.
Write your awesome label here.
Write your awesome label here.
Write your awesome label here.
Write your awesome label here.
With students and collaborators from these institutions
Write your awesome label here.
Write your awesome label here.
Write your awesome label here.
Write your awesome label here.
Write your awesome label here.
Write your awesome label here.
Write your awesome label here.
Write your awesome label here.
Write your awesome label here.
Write your awesome label here.
Write your awesome label here.
Write your awesome label here.
With students and collaborators from these universities
Write your awesome label here.
Write your awesome label here.
Write your awesome label here.
Write your awesome label here.
Write your awesome label here.
Write your awesome label here.
Write your awesome label here.
Write your awesome label here.
Write your awesome label here.
Write your awesome label here.
Write your awesome label here.
Write your awesome label here.
and many more...!
What students say about our courses
Featured links
Get in touch
-
Visualize your Science AB,
Company ID: 2754269-4 -
Pihatörmä, 02240 Espoo, Finland
-
support@visualizeyourscience.com
Connect with us
-
Facebook
-
X (Twitter)
-
Instagram
-
Linkedin
-
Pinterest
Elsa Arrázola
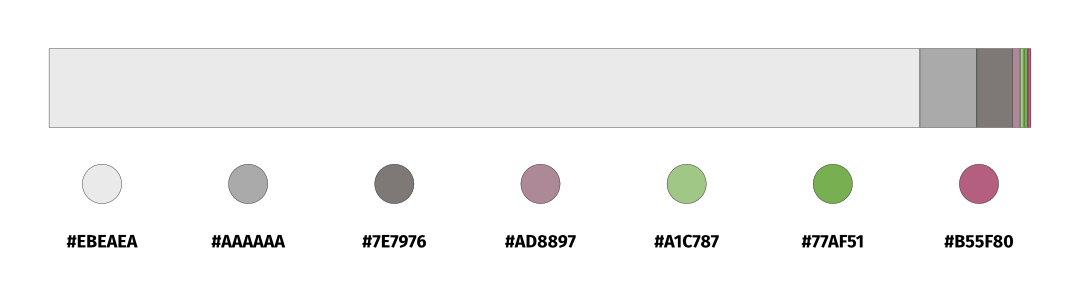
Pallette
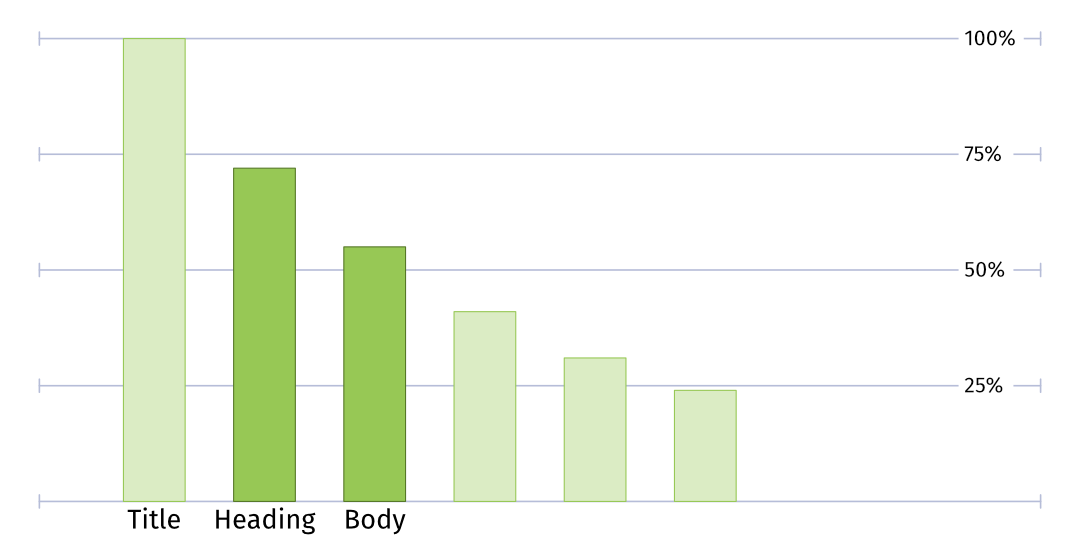
Text hierarchy