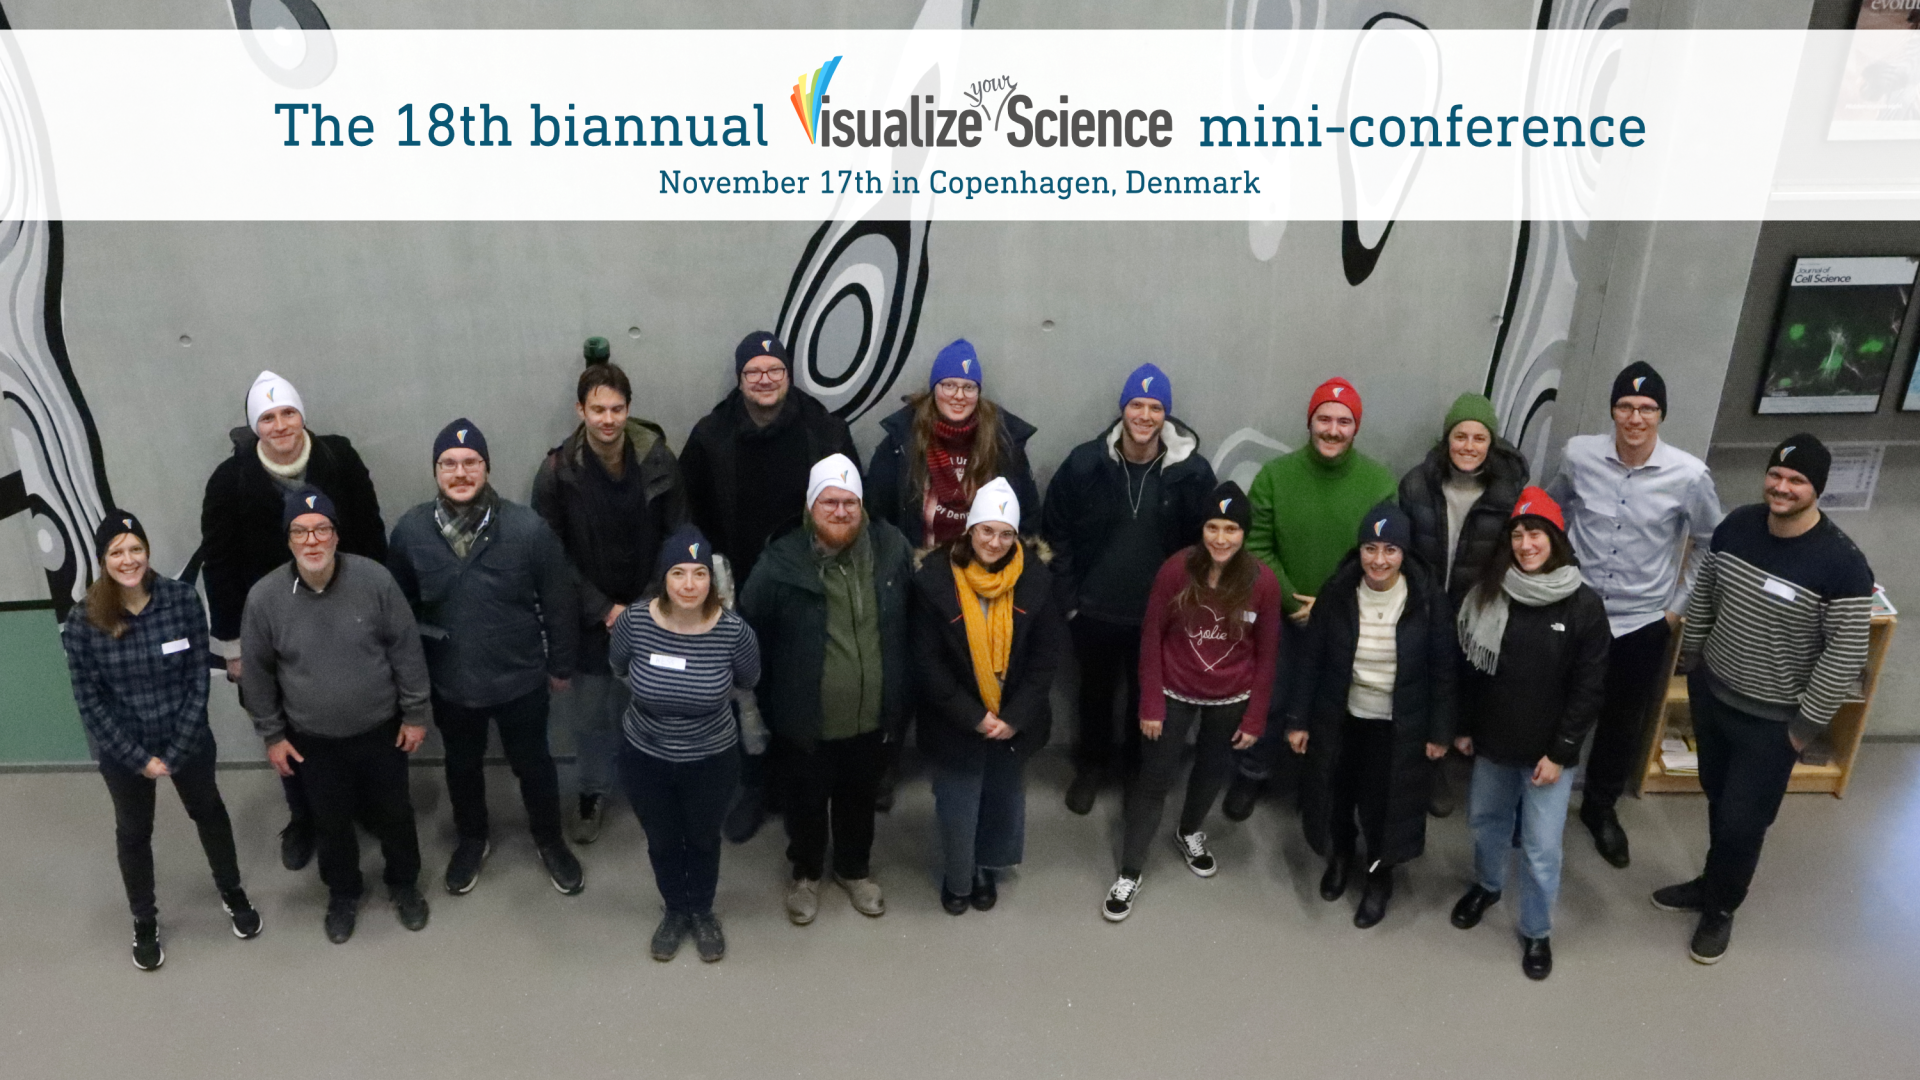
Twice a year, we roll out the red carpet for our mini-conference, in sync with the Spring and Autumn editions of the Visualize your Science course. On November 17, we had the pleasure of hosting the conference for the 18th time! 26 enthusiastic students joined us in the Biocentre of Copenhagen University in Copenhagen, Denmark.
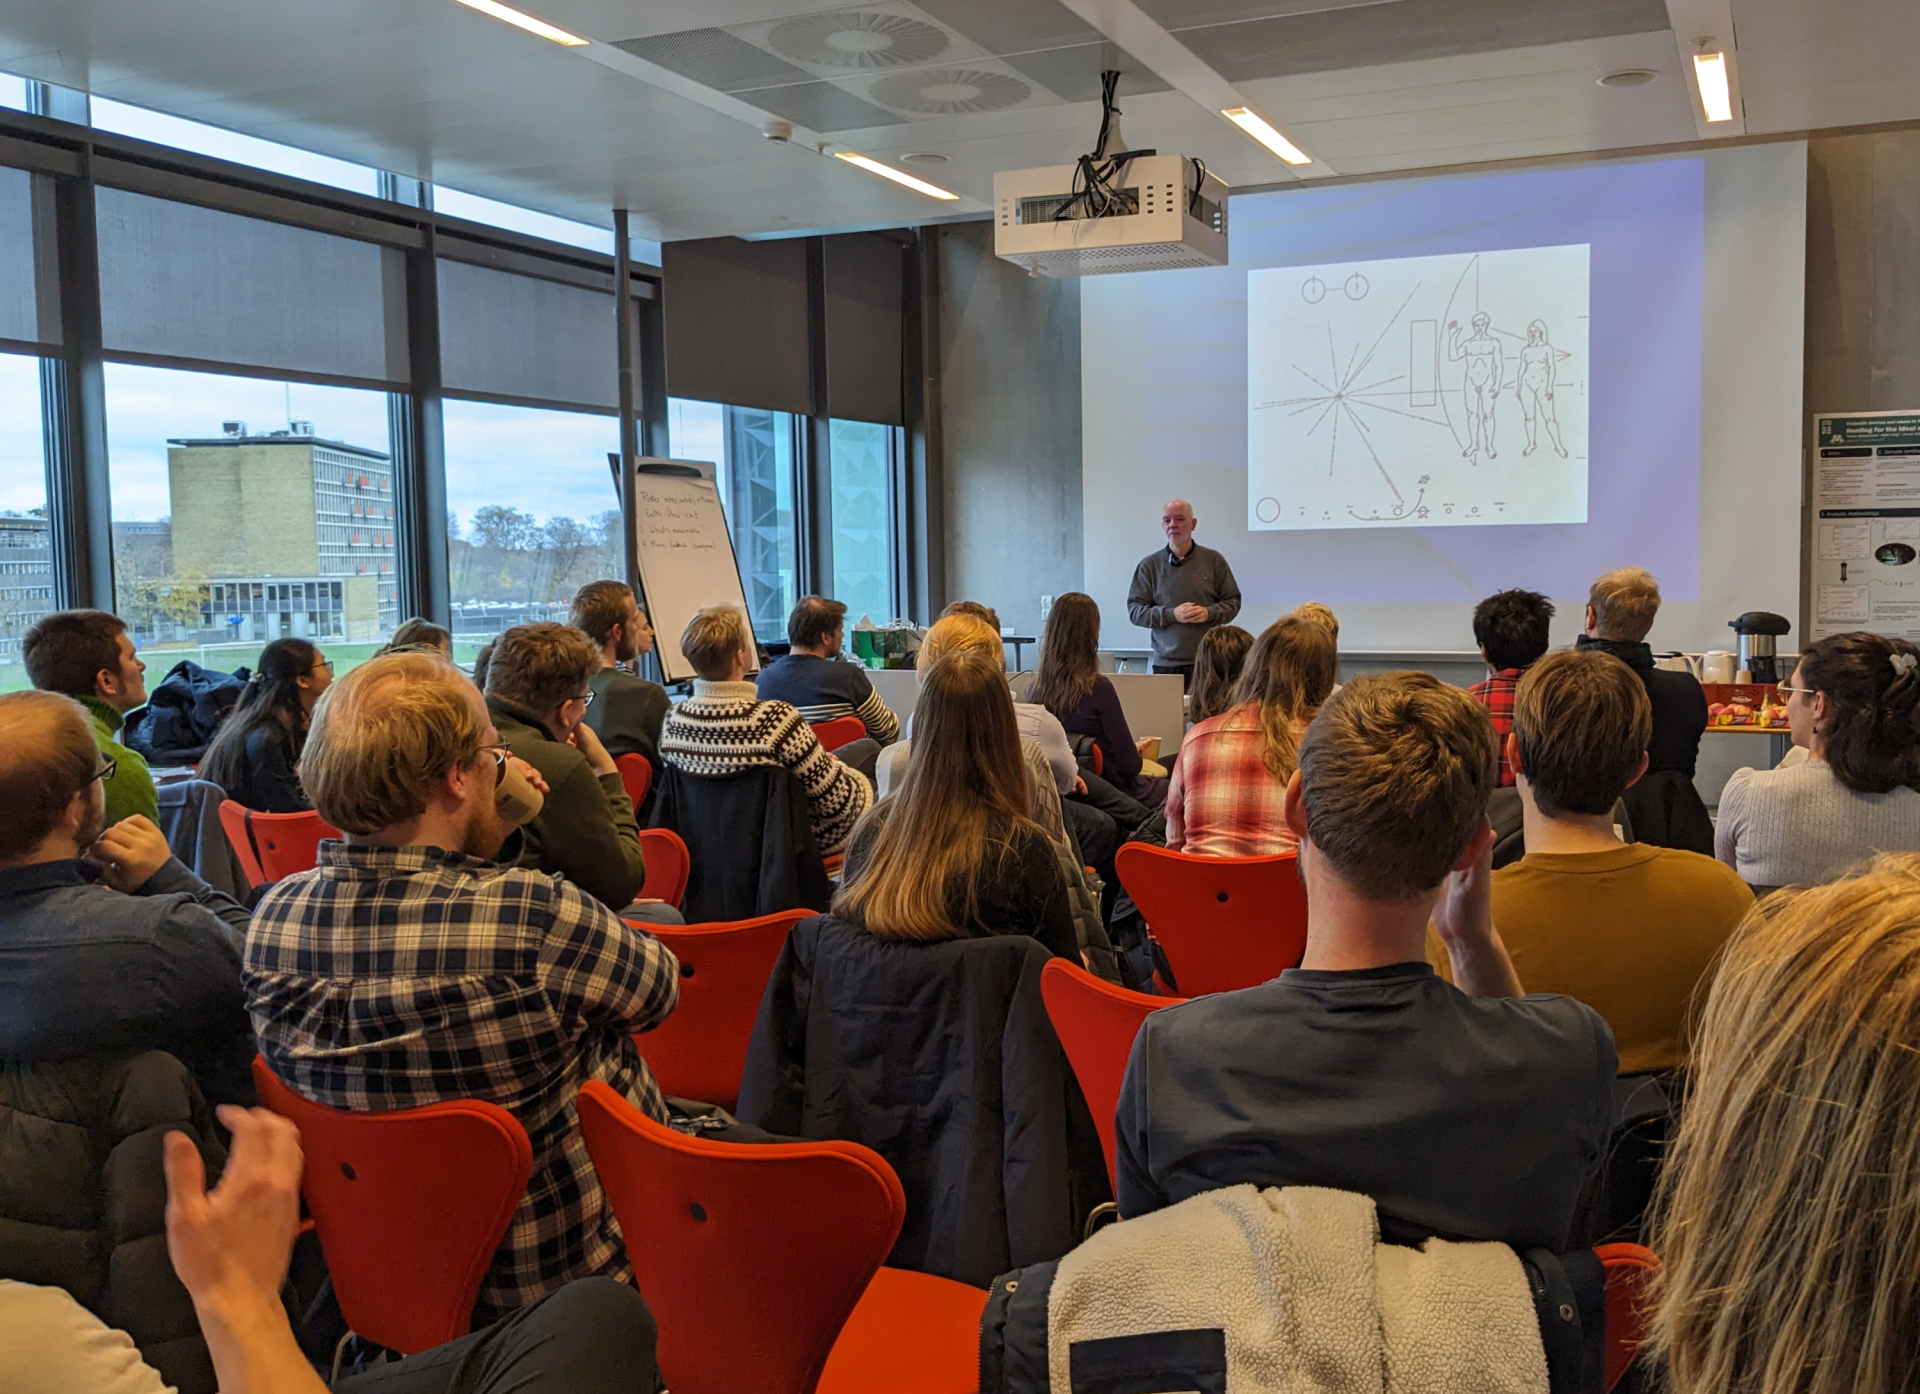
As usual we admired the posters made by the students in the course and enjoyed a lecture about Visual Storytelling by Jonas Dagson. Jonas worked as a graphic designer for the Swedish news agency TT for many years. His lecture was inspiring and he brought in a different perspective on graphic design with his feedback on the student posters.
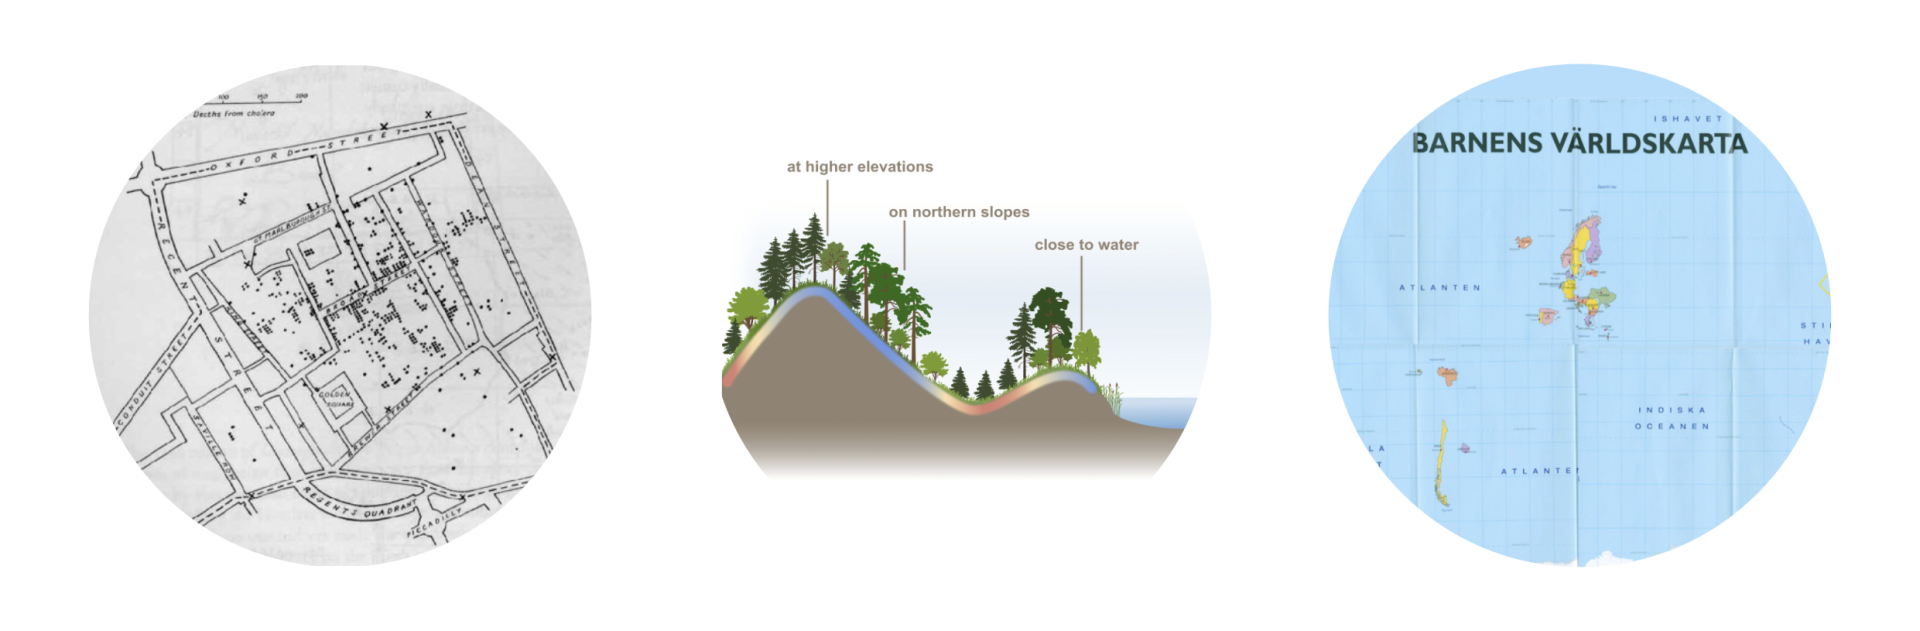
During his presentation, Jonas delved into numerous timeless examples from the realms of data visualization, graphic design, and communication. One standout among these examples is Dr. John Snow's 1854 map depicting the cholera outbreak in London's Broad Street region, shown to the left. Another compelling instance is a data visualization featured on the poster created by course participant Caroline Greiser in 2018. For a more detailed view, you can explore it in a larger format on our Poster Wall (go to the 2018 tab and locate Caroline's poster there). The final example, situated on the right, is the poignant Children's World map crafted by the Swedish Red Cross.
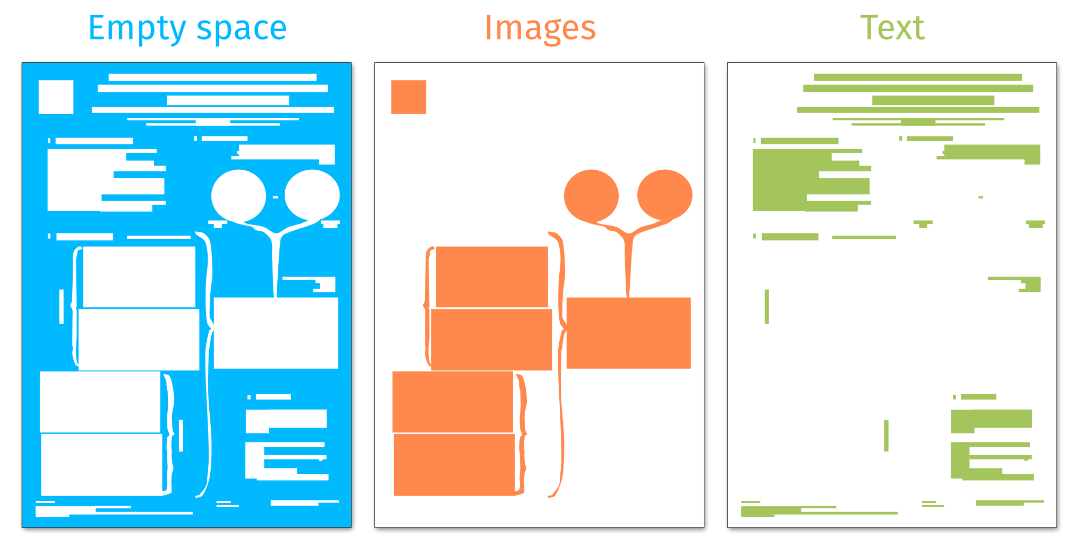
The posters exhibited an exceptional level of quality, making it impossible, as always, to single out a winner for a best poster—each one would be a winner in any other conference! One particular poster drew significant attention due to its remarkable ingenuity and creativity. Crafted by Elena Carrasquer-Alvarez from the University of Copenhagen, this standout piece featured an interactive element at the main entry point, capturing the curiosity of all of us.
For those of you who are alumni to the course and were not able to join the mini-conference this year, or the year you attended the course, you can get in contact with us if you are interested in being invited to the next mini-conference which will be held in May 2024. The location is yet to be decided but it will most likely be in Uppsala, Sweden. Even if you already passed the course, you are more than welcome to join and present your poster.
Thank you to all the students who came, some even travelled all the way from Stockholm to join us! It was an inspiring day, and we are already excited for the next conference. We hope you all enjoyed the day as much as we did!